plot_palette() plots a palette from a vector of colour values (name or hex).
Usage
plot_palette(values, label = TRUE, square = FALSE)
Arguments
- values
[character]
Vector of named or hex colours.
- label
[bool]
Do you want to label the plot or not?
If values is a named vector the names are used for labels, otherwise,
the values.
- square
[bool]
Display palette as square?
Value
The input (invisibly).
Examples
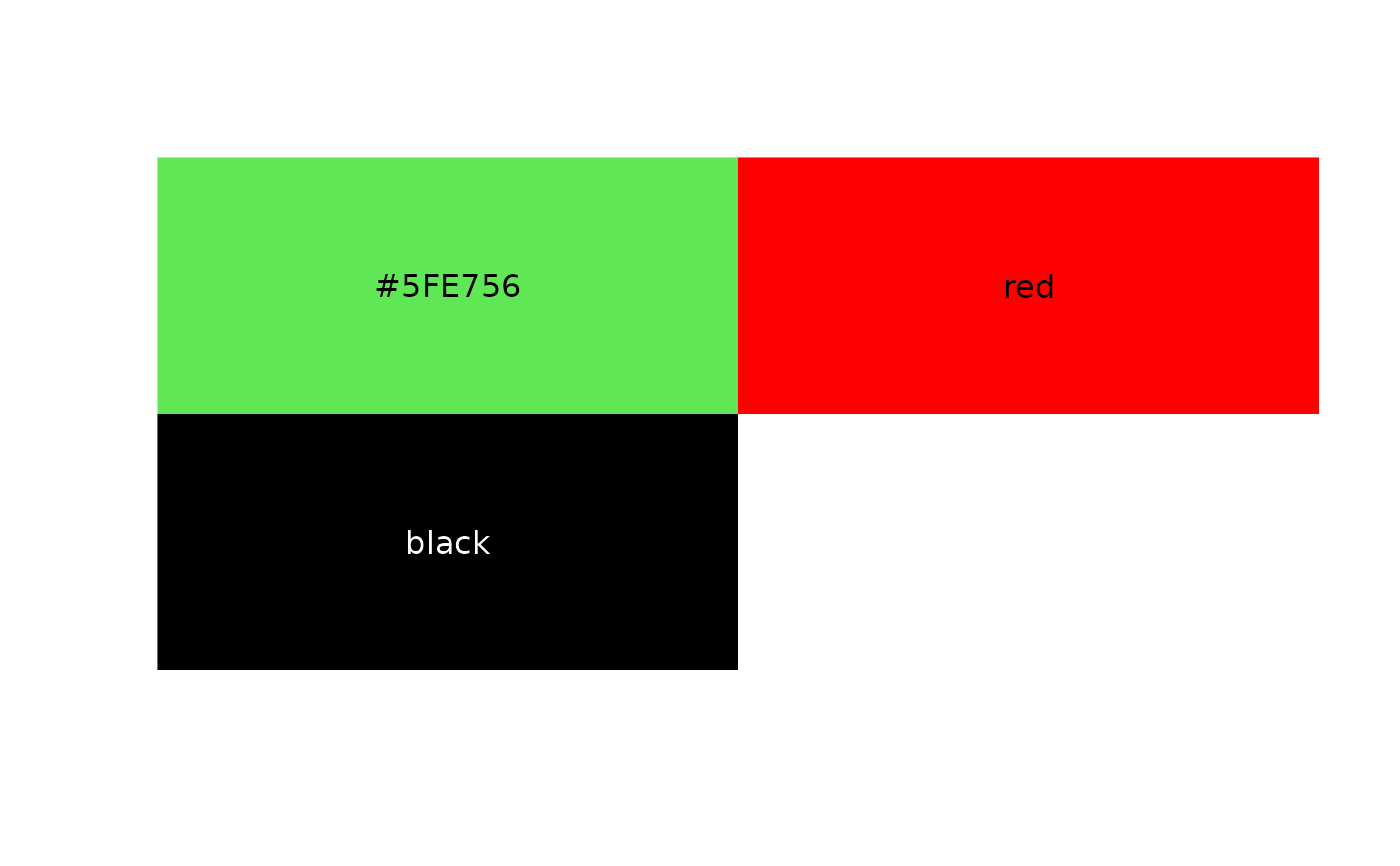
plot_palette(c("#5FE756", "red", "black"))

plot_palette(c("#5FE756", "red", "black"), square = TRUE)